Using Code Atlas to Understand AI-Generated Code
Code Atlas turns source code into interactive diagrams showing function calls, file relationships, and control flow. Built it because I'm a visual learner.
Code Atlas turns source code into interactive diagrams. Point it at a codebase and it shows you which functions call which, how files connect to each other, and what the control flow looks like inside individual functions. I built it because I needed a way to understand code that doesn't involve reading it line by line.
Last year I built a web app using Claude. It took months of back-and-forth, debugging sessions, and rewrites. By the time it worked, I understood every piece of it because I'd touched everything multiple times.
With Opus 4.5, I could probably rebuild that same app in less than a day. It one-shots things that used to take dozens of iterations. That's great for productivity, but it creates a problem: if the AI gets it right immediately, when do I actually learn how it works?
I'm a visual learner. Having Claude explain what it built is fine, but I read the description, nod along, and forget most of it. Diagrams work better for me.
So I built Code Atlas
The tool parses source code and turns it into interactive diagrams. No AI involved in the visualization part, just deterministic parsing and graph rendering.
Here's what it looks like when you throw a medium-sized codebase at it (18 files, 90 functions, 89 cross-file calls):
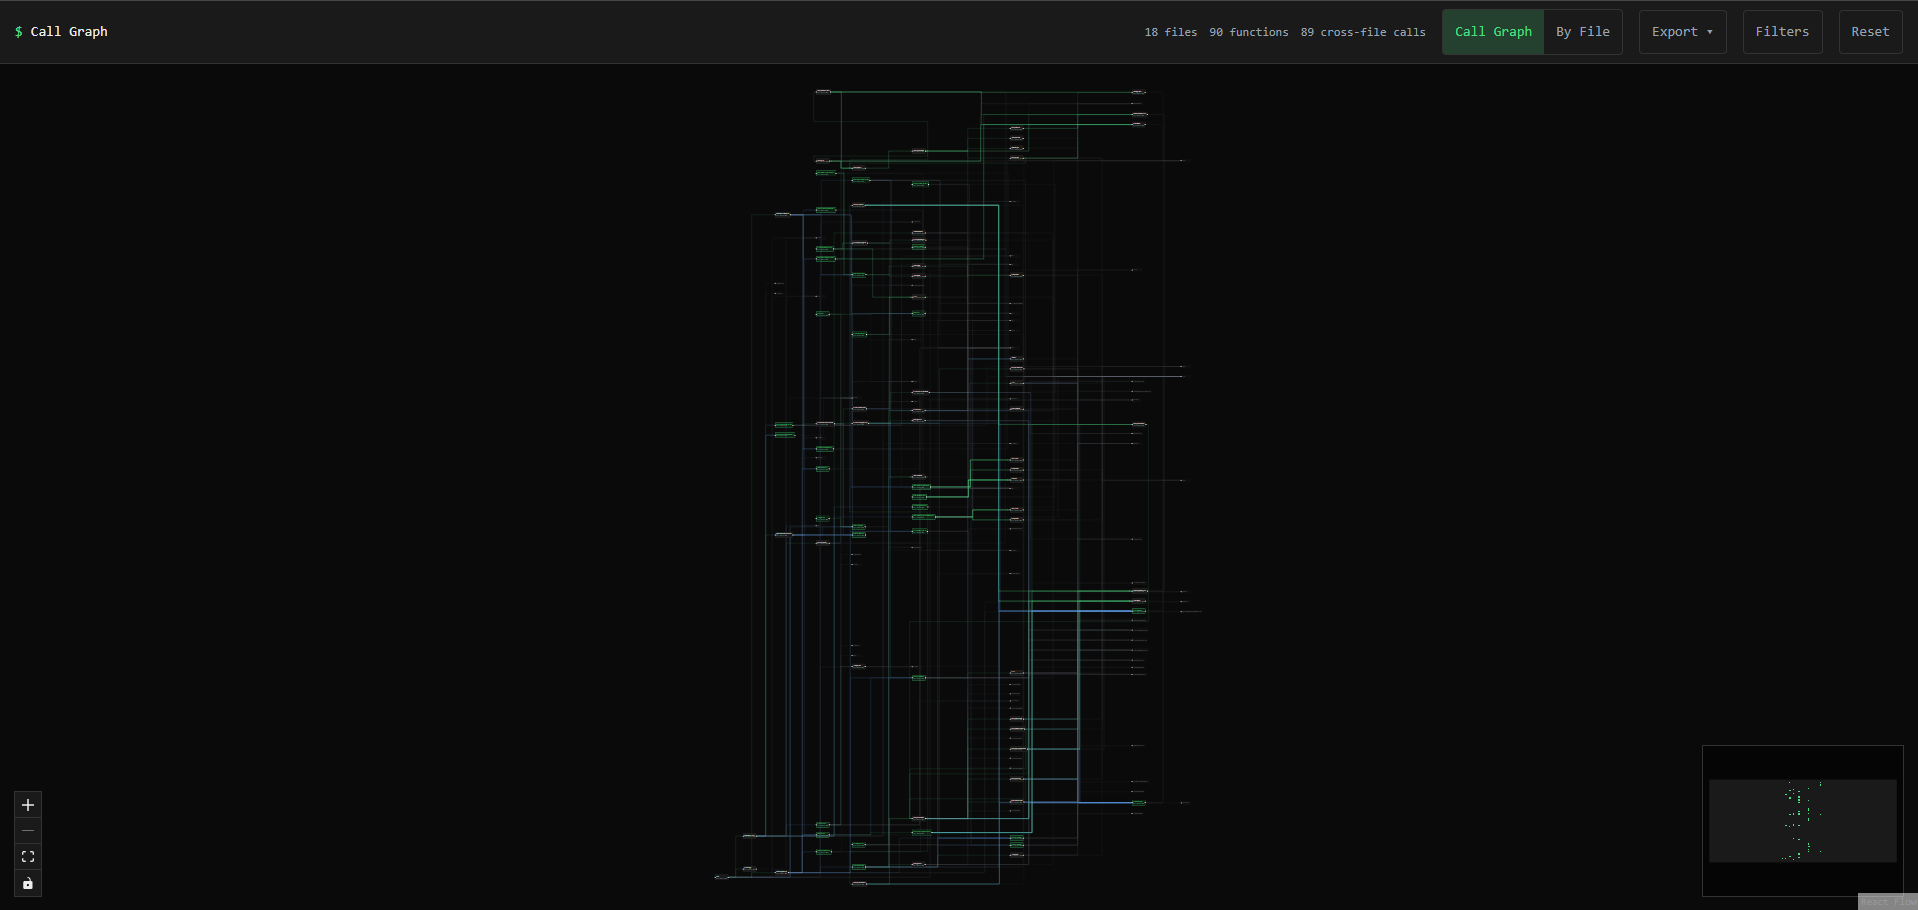
You're not supposed to read every label at this zoom level. The point is getting a feel for the overall shape. Where are the dense clusters? What's isolated? Are there any suspiciously long call chains?
Grouping by file makes it readable
That full call graph is pretty overwhelming. Switching to Project View groups everything by source file, which makes smaller codebases actually legible.
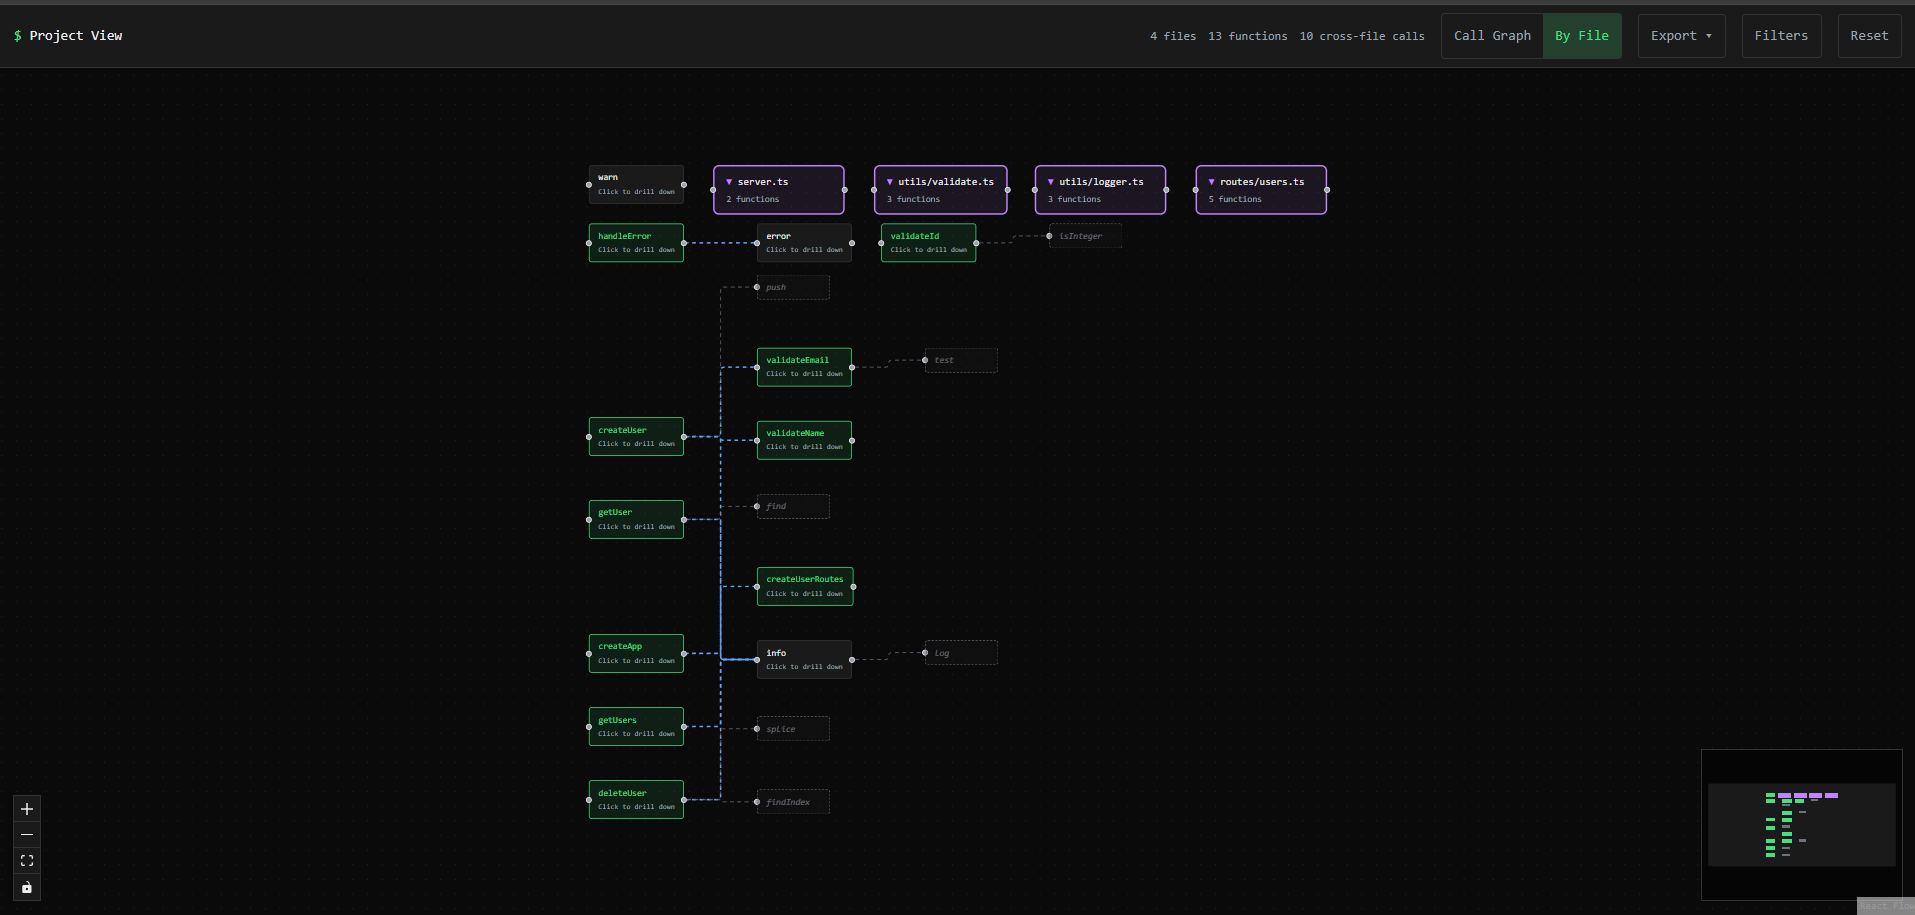
This one's a simple Express API: 4 files, 13 functions. Now I can actually follow the flow. server.ts hits the route handlers, which call into the utils for validation.
Tracing connections
Right-clicking a function highlights everything connected to it:
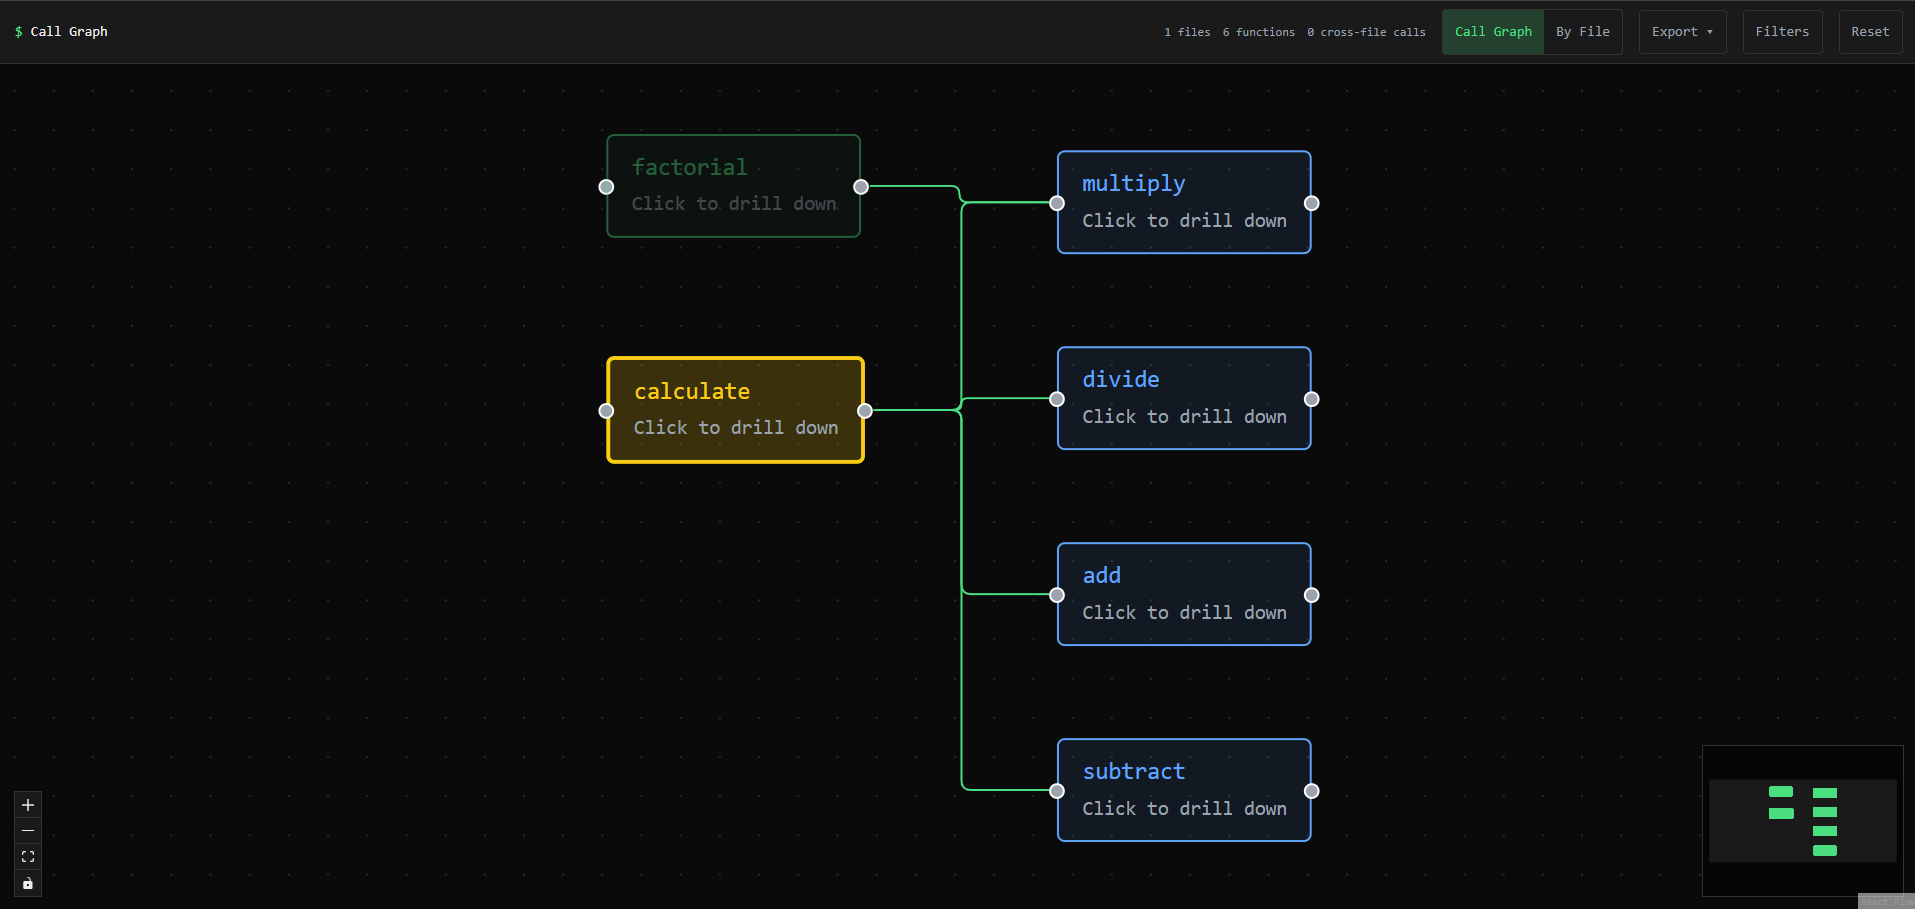
Yellow is what you selected, blue is what connects to it, everything else dims out. Useful for answering "if I change this function, what else might break?" Getting this feature working was its own adventure, actually. The first implementation caused an infinite re-render loop that froze the browser on every click.
Control flow for the internals
Clicking a function shows its control flow diagram:
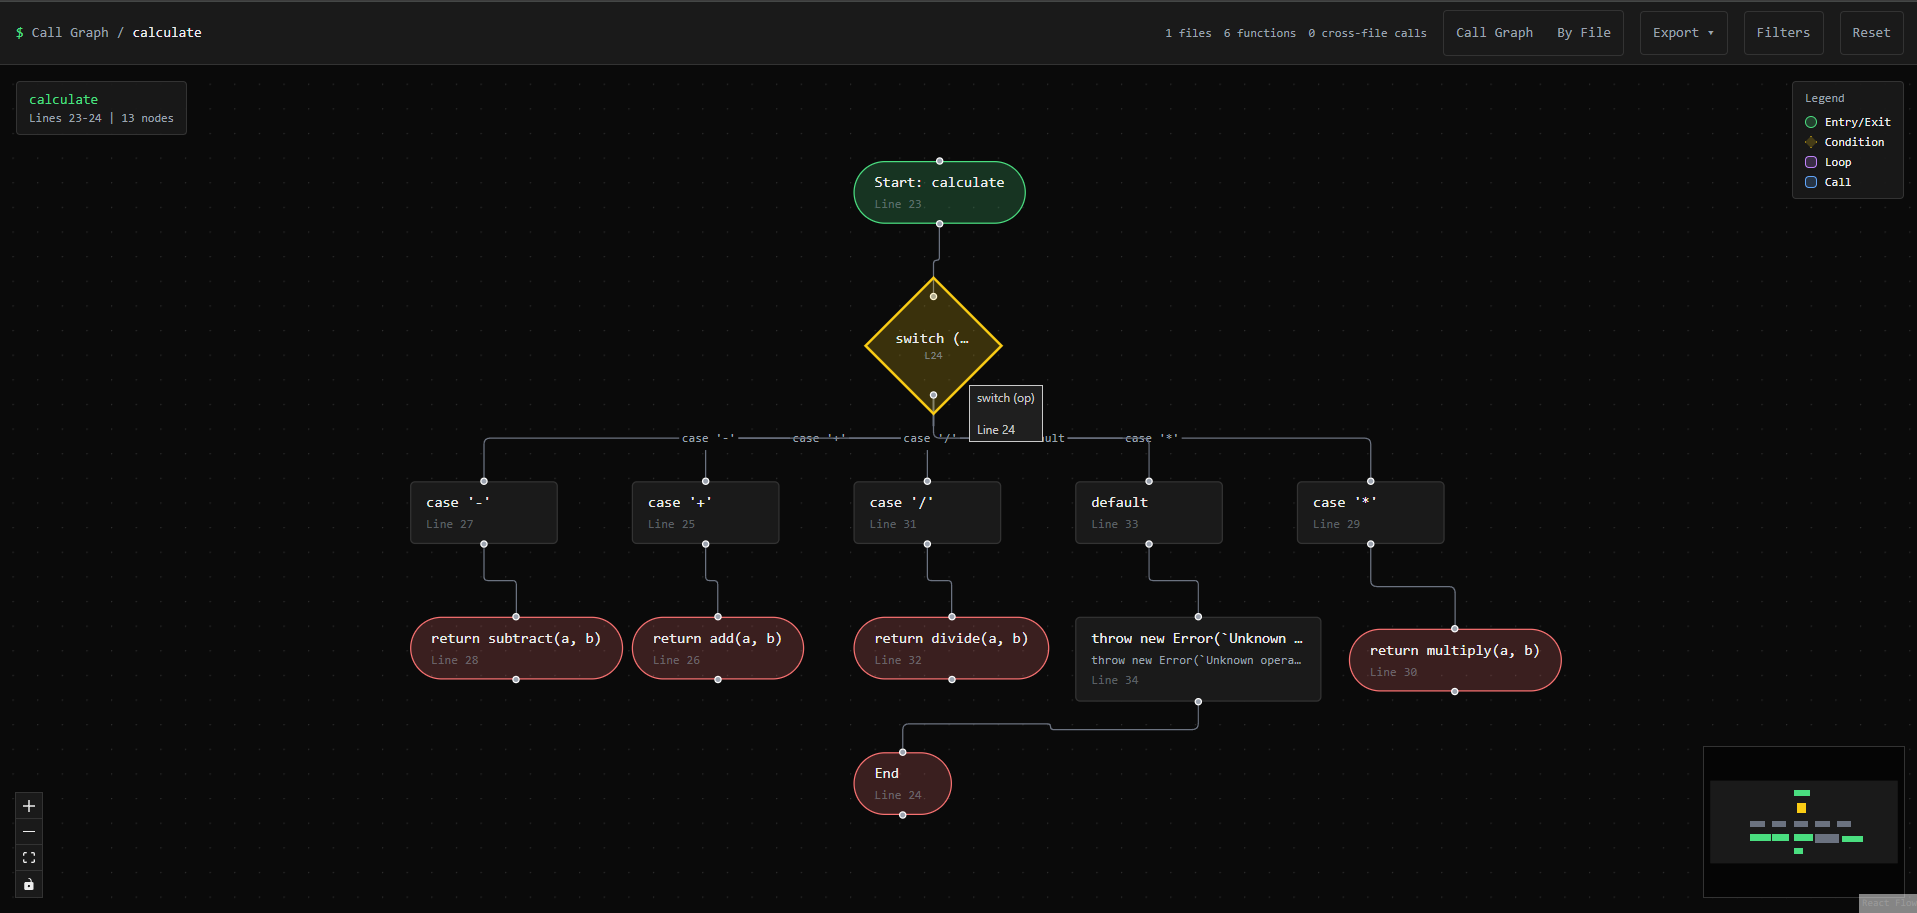
That's a calculate function with a switch statement handling five operations. Seeing the branches laid out like this is faster than mentally parsing nested conditionals.
The MCP server for Claude Code
The viewer is for me, but I also published an MCP server so Claude Code can use the same analysis tools. I asked Claude (honestly, I told it to not just tell me what I wanted to hear) whether this actually helps.
It doesn't "see" diagrams the way I do. When Code Atlas outputs a Mermaid diagram, Claude processes it as structured text. But it said the relationship data is genuinely useful for efficiency. Instead of running a bunch of Grep and Read calls to trace how functions connect across files, it can run atlas_analyze_project once and get all the relationships upfront.
The viewer is for humans, the MCP tools are for Claude. Same analysis under the hood.
Try it
- Interactive Demo - Upload your own analysis JSON or try the examples
- MCP Server - For Claude Code users (
npx code-atlas-mcp) - Project Page - More details on how it works
Works on TypeScript, JavaScript, and Python. You can analyze individual files or entire project directories.
Why I built this
I needed a different way to learn. Reading code linearly doesn't work well for me, and having Claude explain things only goes so far. Diagrams stick in my head better.
The tool is simple on purpose. No AI in the visualization layer, just parsing and graph rendering. The output is deterministic, so the same code always produces the same diagram.
$ ls ../blog/ --project="Code Atlas"