Agent Trace Telemetry
What to measure about an agentic investigation loop, and how a trace explorer turns raw run data into evidence for the next prompt or harness change.
Agentic investigation runs produce a lot of signal you cannot see from the final score alone. This page covers the trace record format, the five scoring dimensions, and the six-tab DuckDB-backed explorer that turns 114 backfilled traces into a diagnostic view over experiments. It is a living document and gets updated as more runs land.
What it is
Each investigation run writes a JSONL trace record with the inputs, decisions, tool calls, token counts, post-hook nudges, and final score. A Marimo notebook loads every JSONL file through DuckDB and exposes six tabs (Overview, Scores, Tokens, Tools, Enforcement, SQL) with charts for each class of signal. The tabs are designed around a "good vs investigate" framing so the next experiment has somewhere to aim.
Why it exists
Before the trace explorer, an experiment produced a composite score and nothing else. A regression from 9.3 to 7.0 was visible. The reason was not. The bottleneck could live in triage ordering, evidence depth, coverage, field completeness, efficiency, or some combination. Picking the wrong dimension to fix burns a whole experiment cycle.
The telemetry layer fills the gap between "the score changed" and "here is what to change next."
What we measure
Scoring dimensions (five, weighted to a 0 to 10 composite):
| Dimension | Weight | What it captures |
|---|---|---|
| Triage quality | 25% | Kendall tau between investigation order and anomaly score ranking |
| Evidence breadth | 25% | Distinct sources per finding and source coverage vs available sources |
| Coverage | 25% | Ratio of flagged entities (score at or above 50) actually investigated |
| Structural completeness | 15% | Required fields populated per finding (8 fields checked) |
| Efficiency | 10% | Findings per tool call plus budget utilization |
Per-run JSONL record fields include the obvious (composite score, dimension scores, outcome, model, prompt version) and the ones that matter for diagnostics:
tokens_input_total,tokens_output_total,tokens_wasted(tokens from context that got evicted before being used)total_tool_calls,cache_hits,cache_missesposthook_triggers,findings_rejected,posthook_types(classified nudge categories)findings_submitted,entities_investigatedmessages_at_end(parsed from eviction spans to measure context pressure)
The JSONL format keeps each run self-contained. DuckDB loads all files with read_json_auto(traces/*.jsonl) and everything downstream is SQL.
The six tabs
Overview
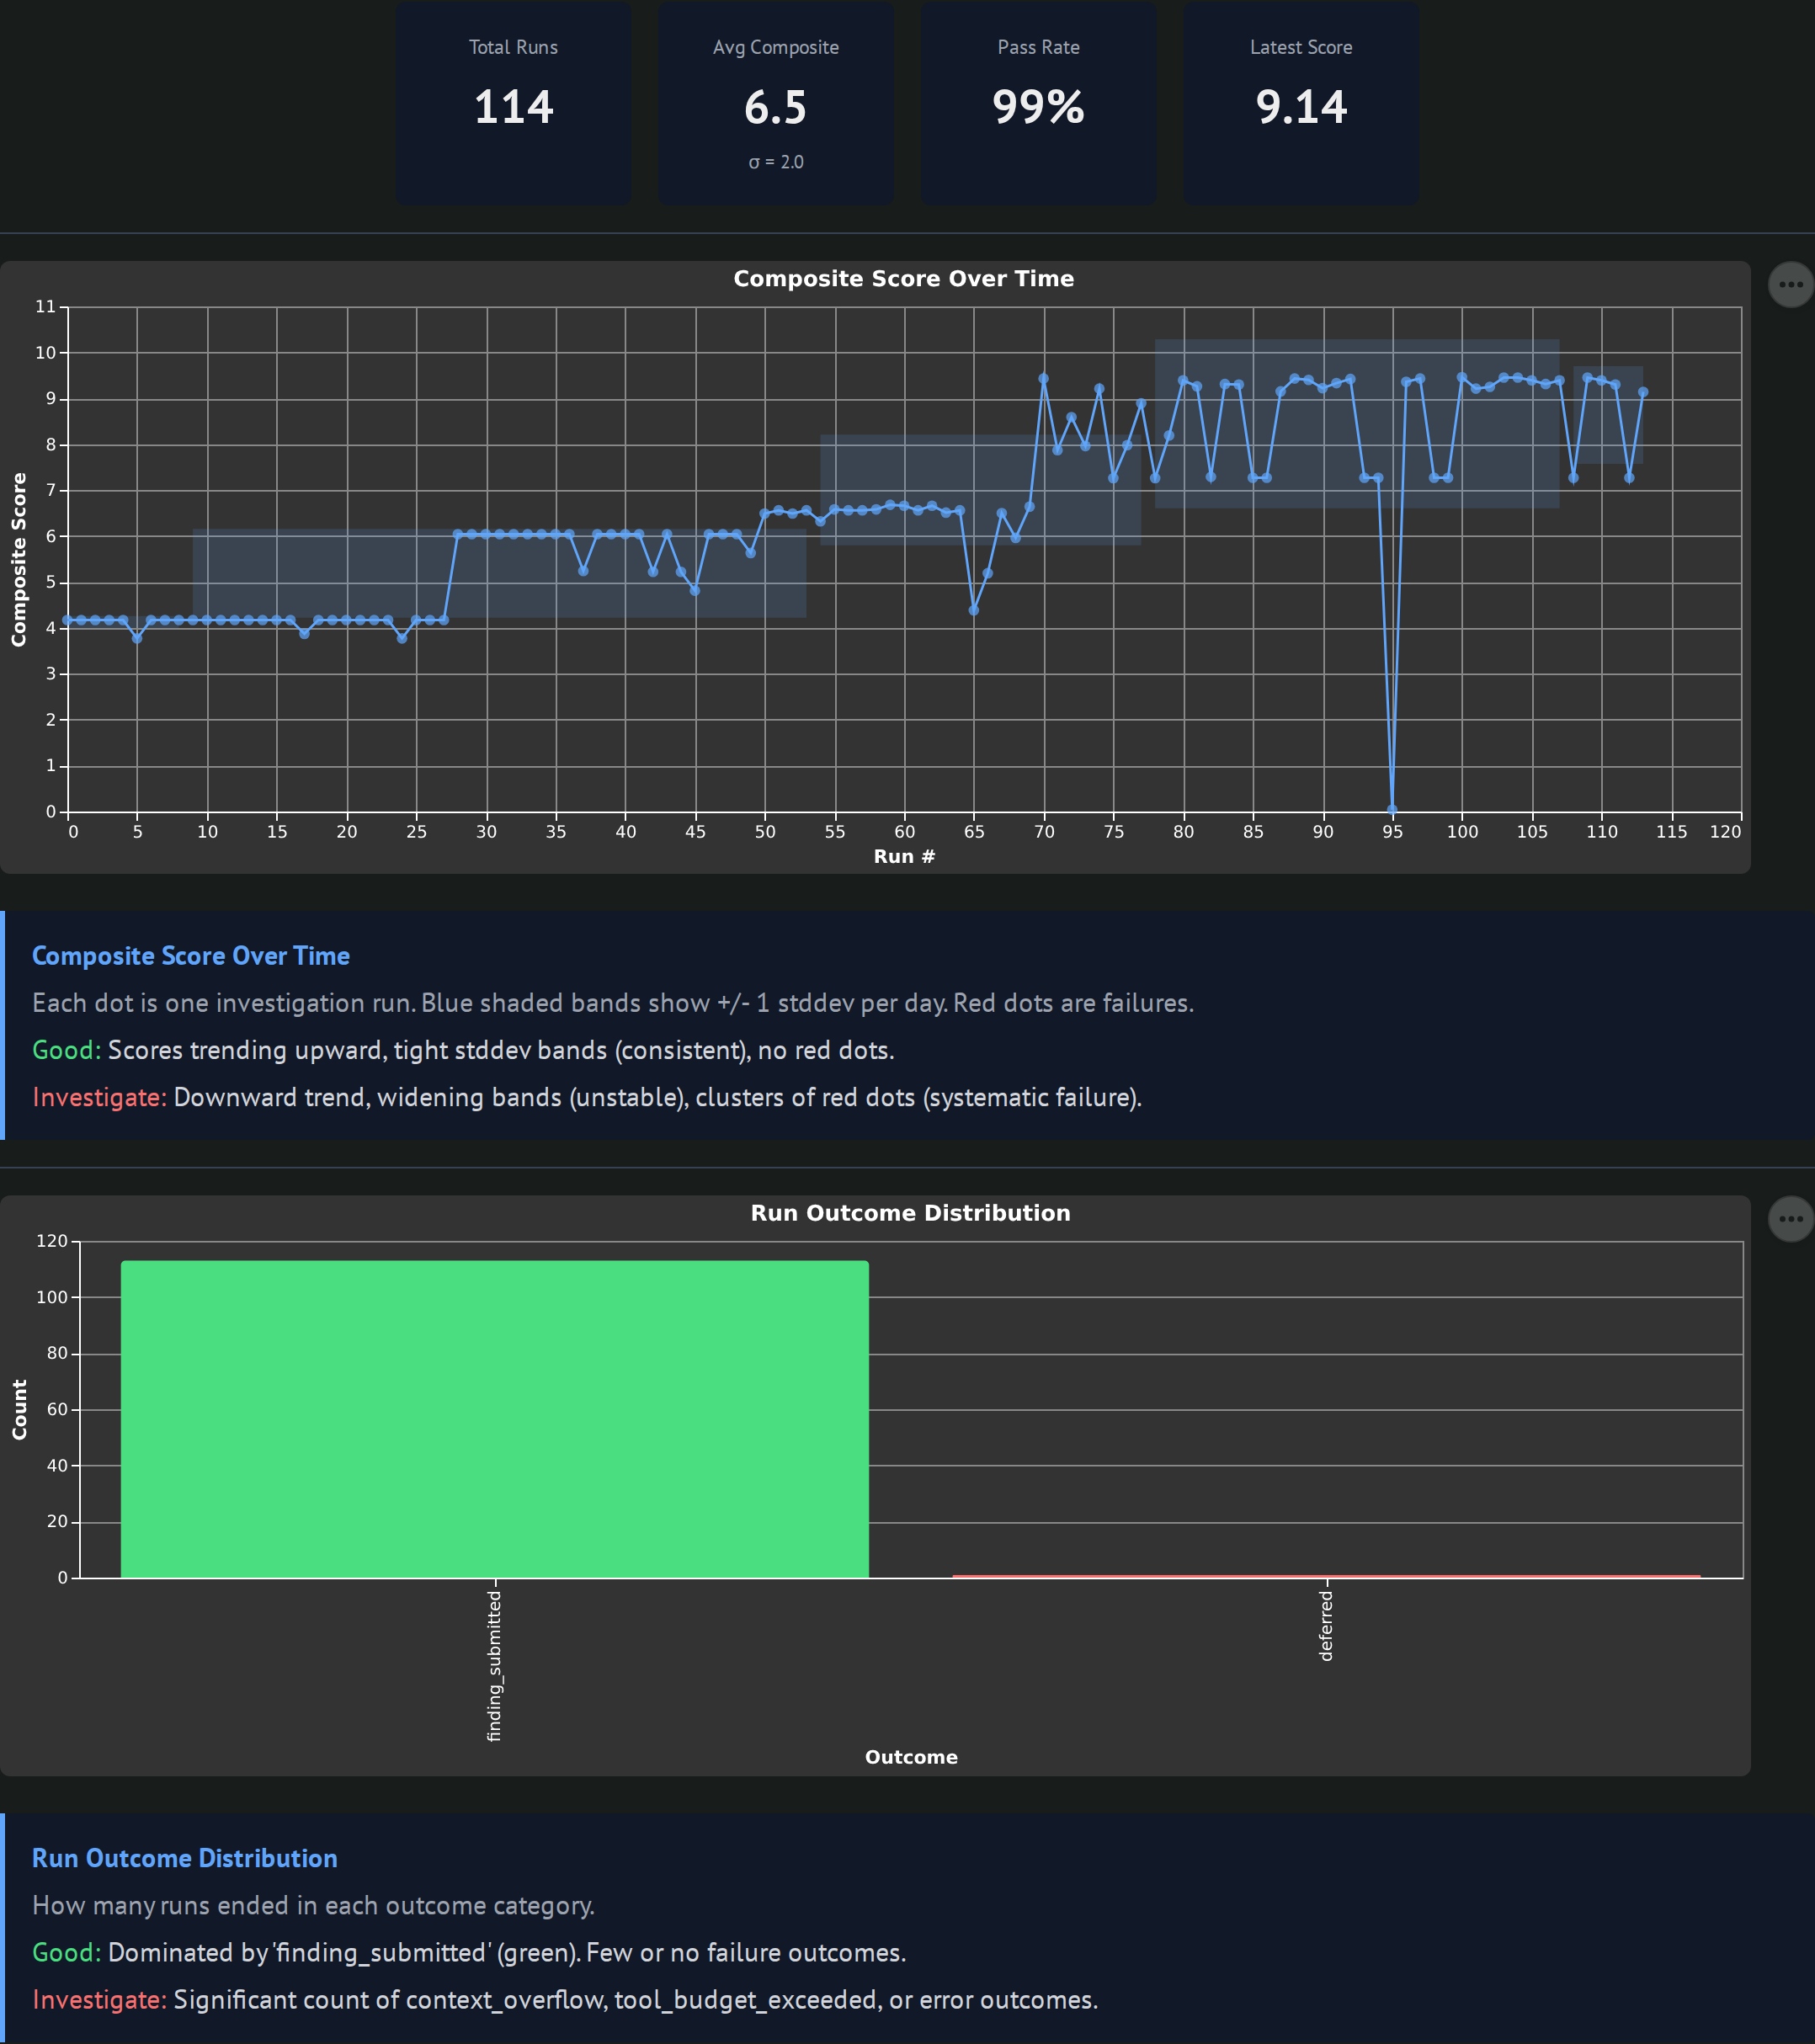
Summary cards (total runs, avg composite with sigma, pass rate, latest score), a composite-score-over-time line with a standard deviation band, and a horizontal bar chart of outcome distribution. Good looks like an upward trend with tight bands and no red dots. Worth investigating when bands widen or clusters of failures appear.
Scores
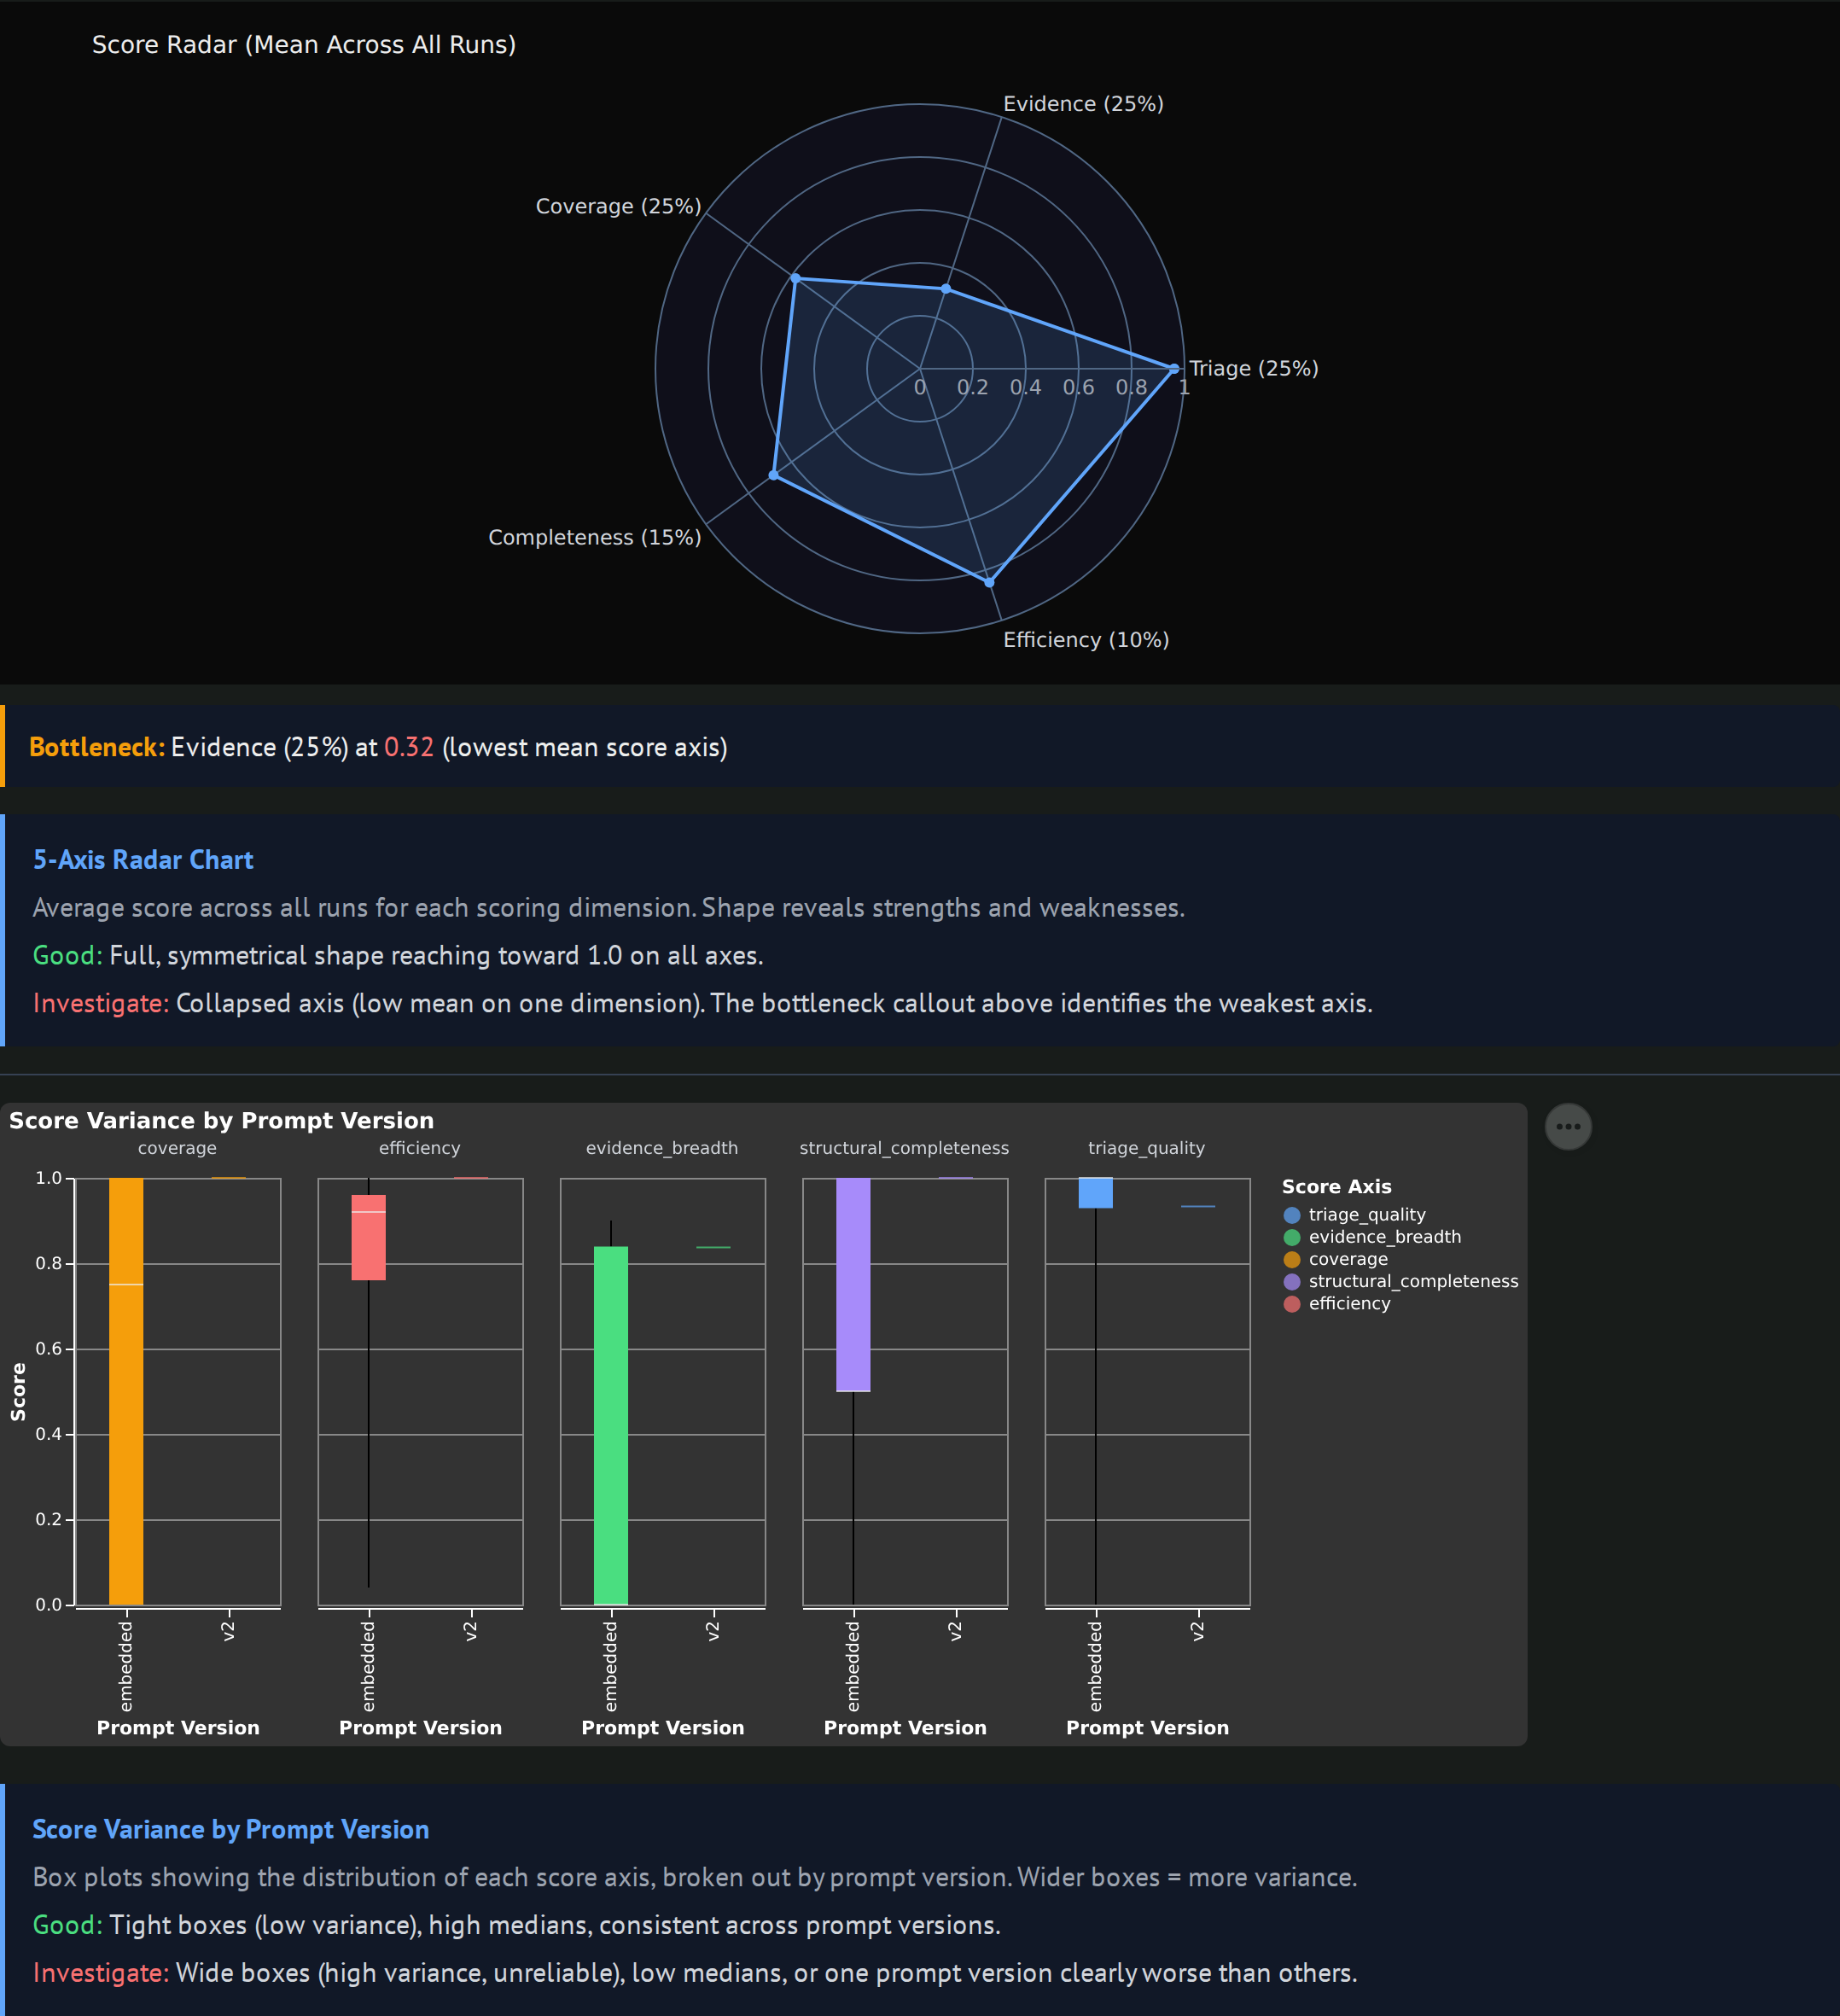
A 5-axis radar chart showing the mean value per scoring dimension, with a "Bottleneck" callout naming the weakest axis. Box plots per prompt_version show how each dimension moves as prompts evolve. Good looks like a full, symmetrical radar reaching toward 1.0 with tight boxes. Worth investigating when one axis collapses (that is the bottleneck to fix next) or when a prompt version has wide boxes (variance without quality).
Tokens
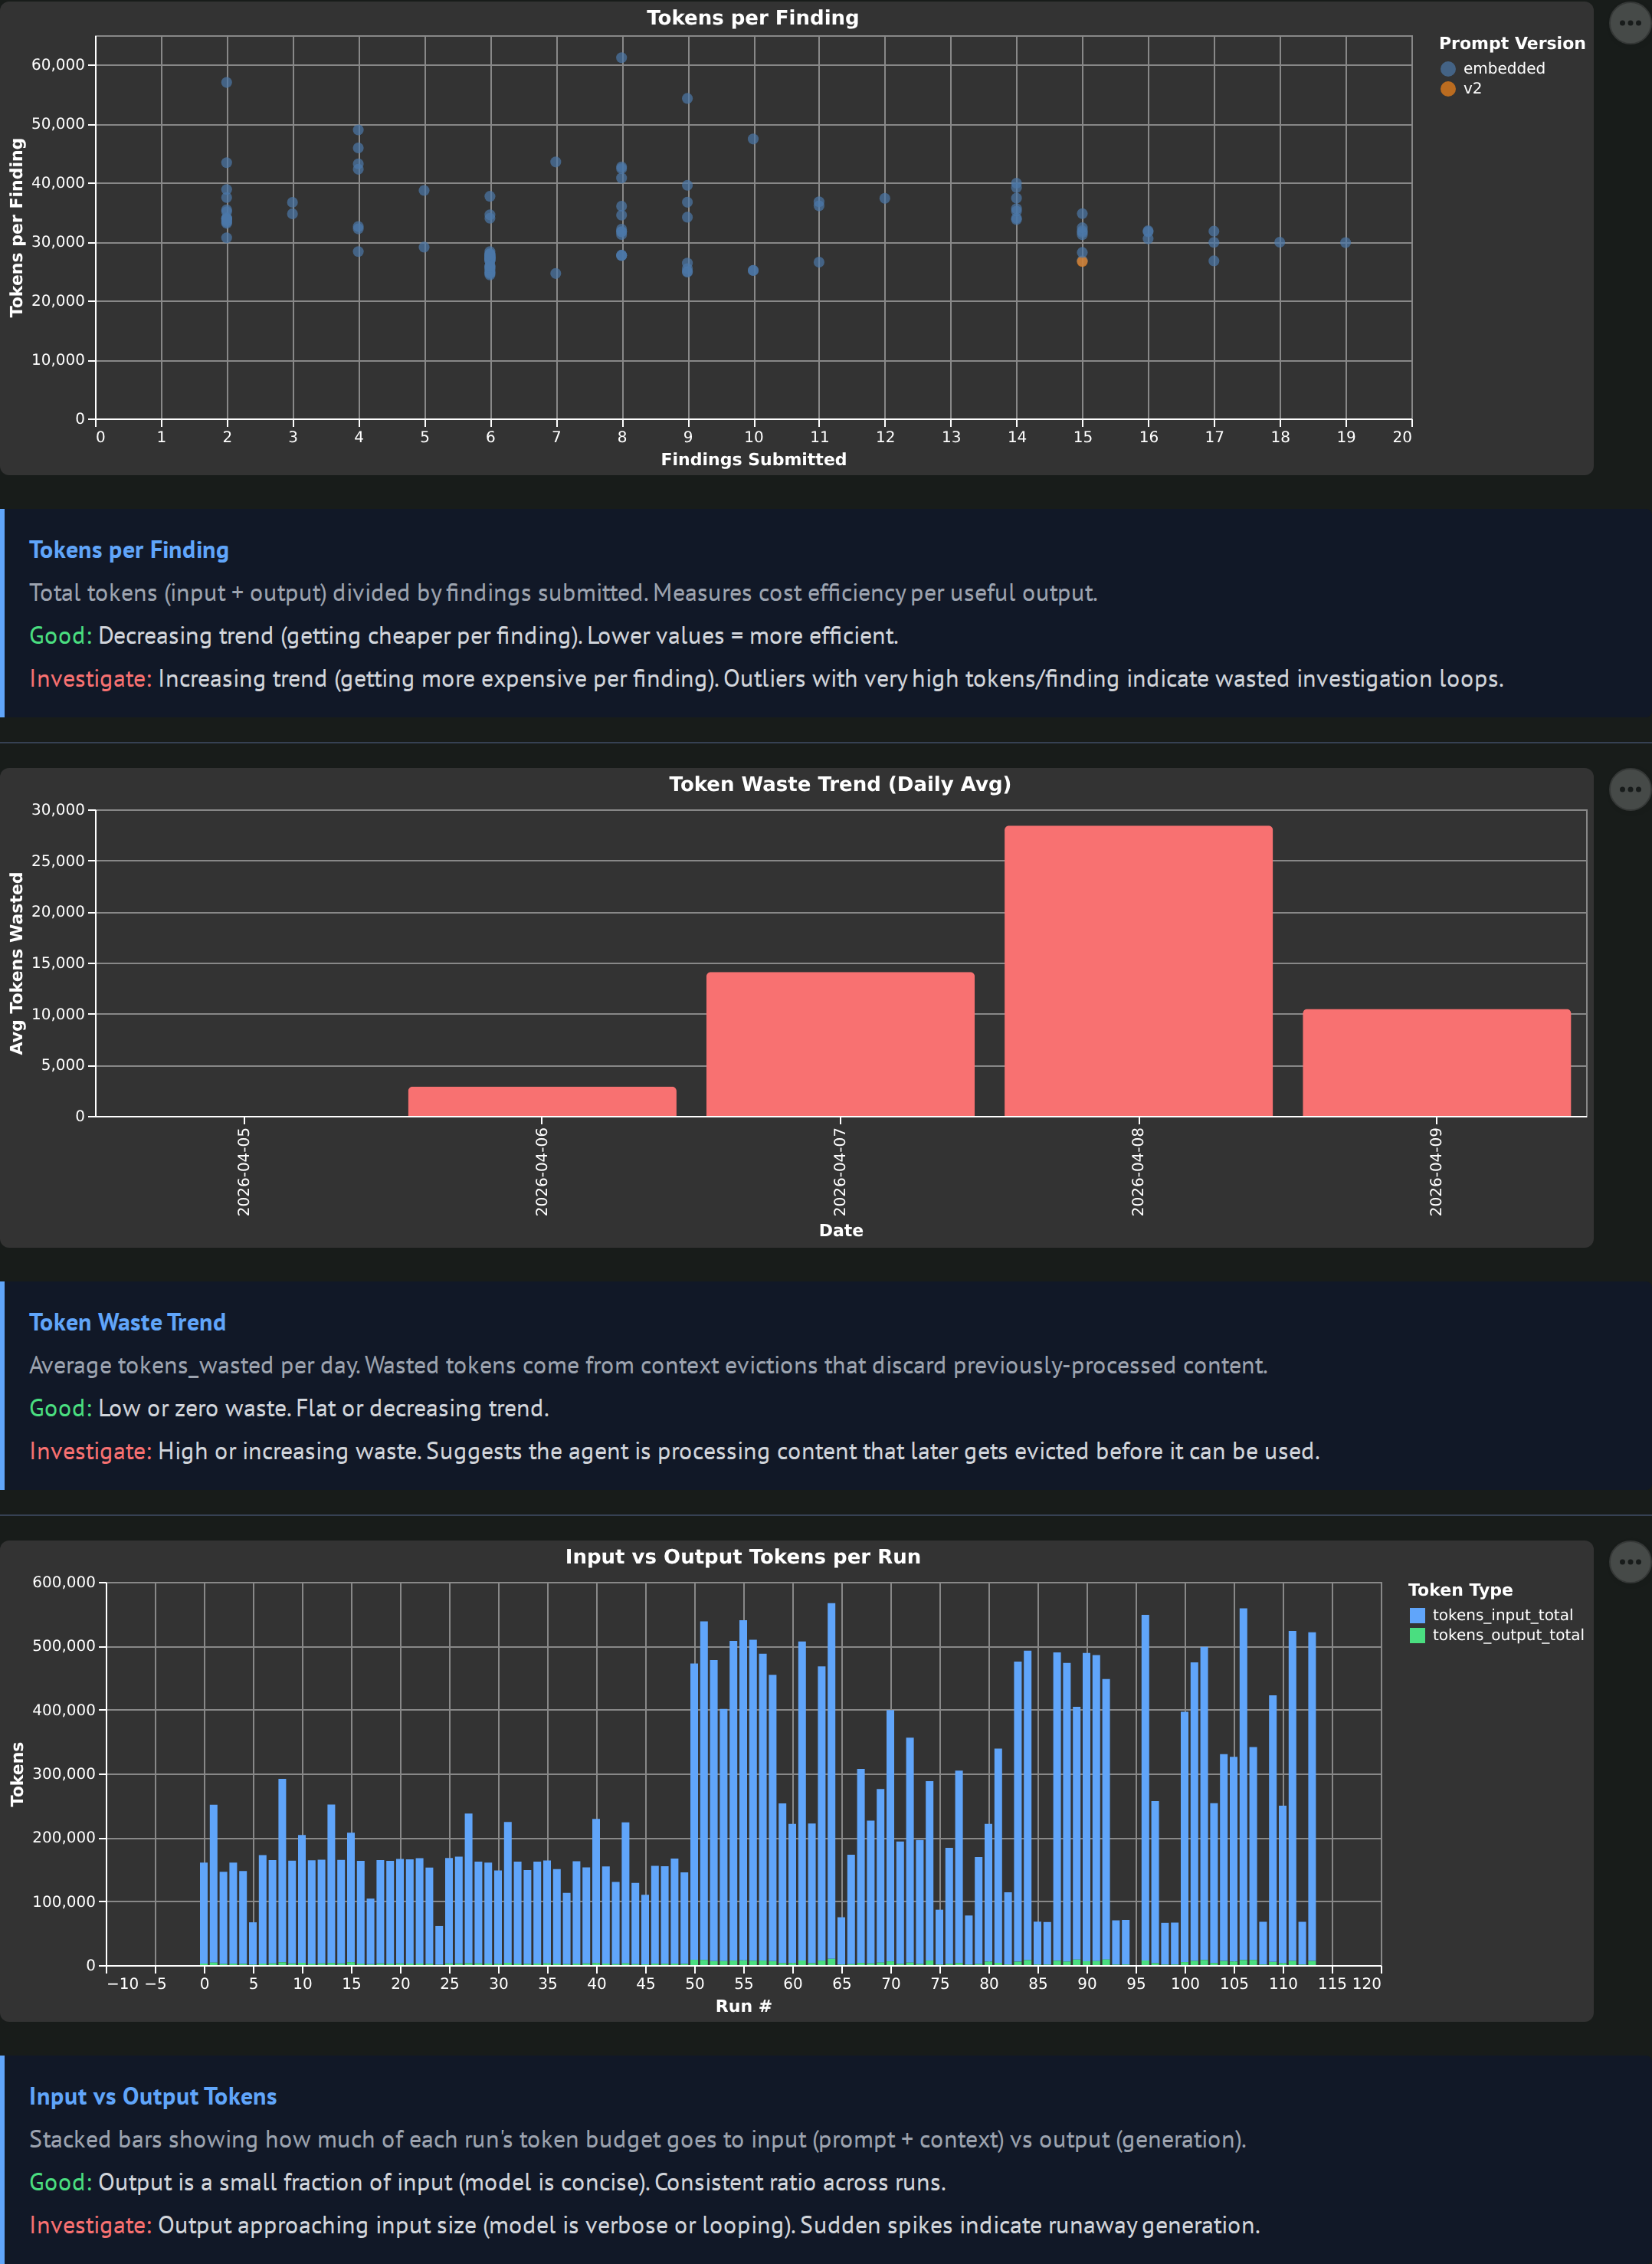
Three charts: tokens per finding scatter colored by prompt version, token waste trend bars, and input vs output stacked bars per run. Token waste is the key metric: input tokens that got evicted from context before the agent used them. High waste means the investigation is processing content it could not exploit, which is usually a context management or loop-discipline problem.
Tools
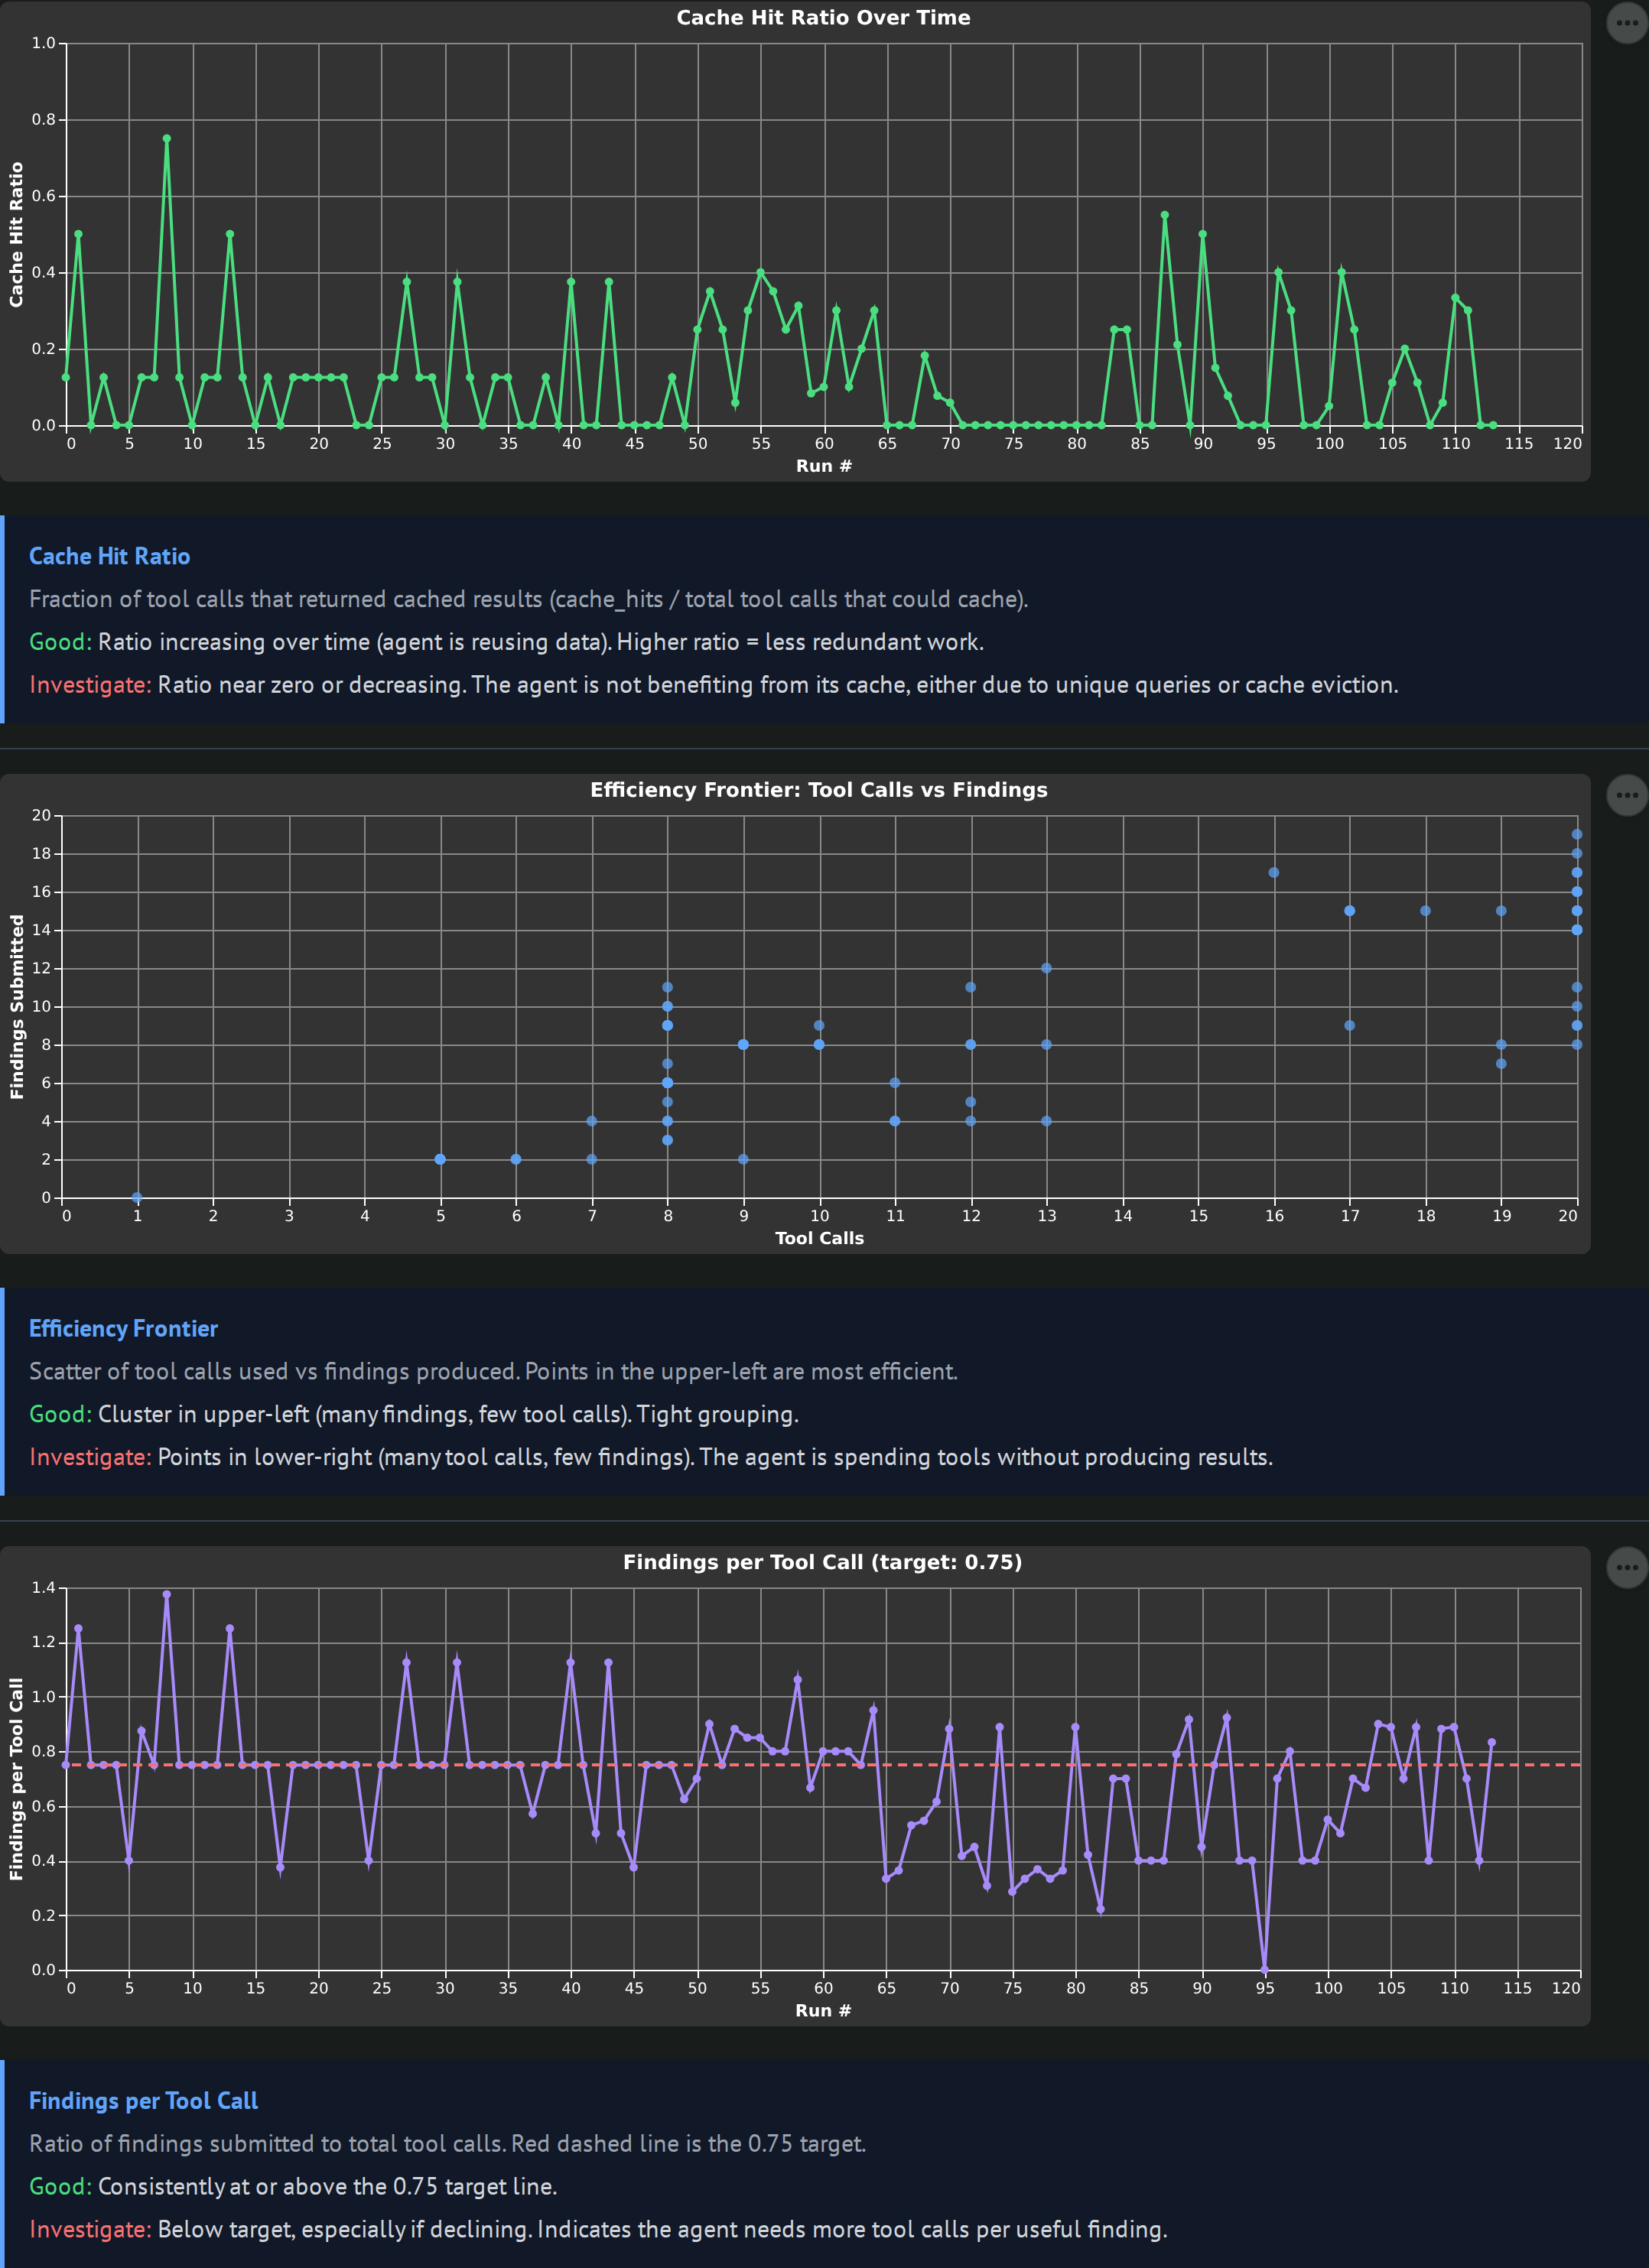
Cache hit ratio over time, a total_tool_calls vs findings_submitted efficiency frontier scatter, and a findings-per-tool-call line with a target rule at 0.75. The efficiency frontier is the most useful one: upper-left means lots of findings from few tool calls (good), lower-right means lots of tool calls with few findings (the agent is grinding).
Enforcement
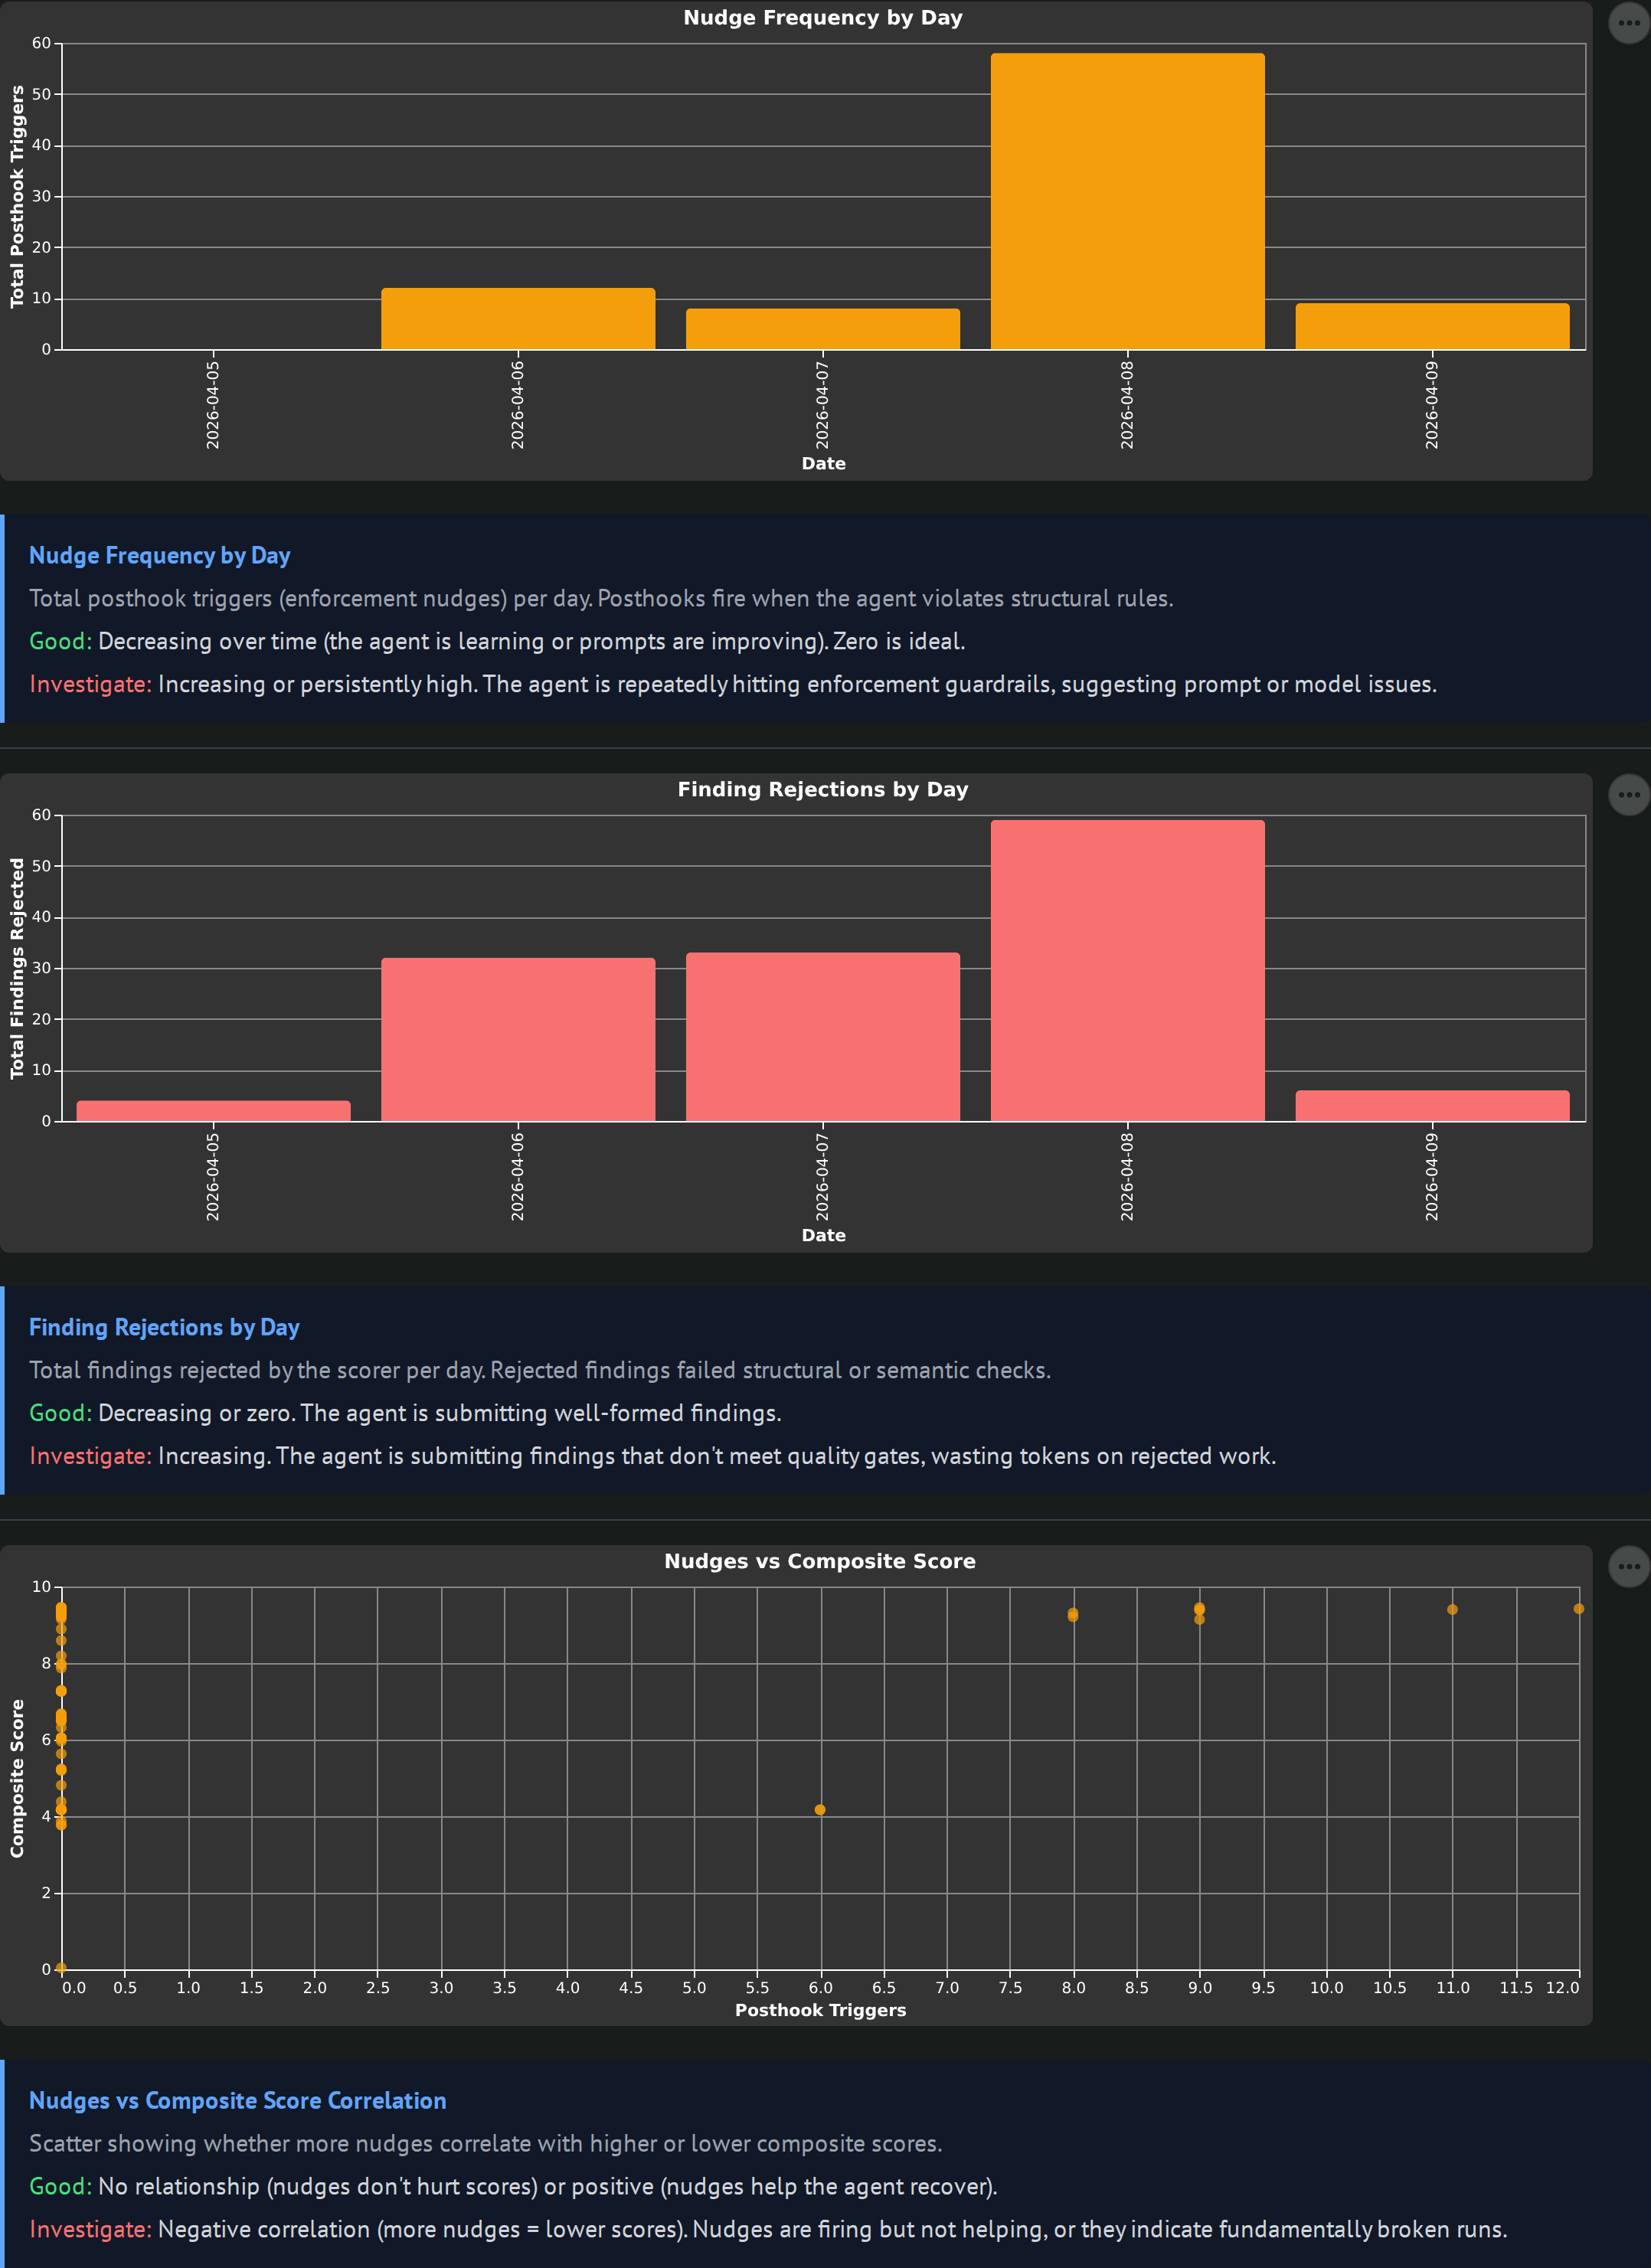
Nudge frequency by day (post-hook triggers), rejection frequency by day (findings that failed validation), and a nudges vs composite scatter. Post-hooks fire when the agent breaks a structural rule (missing required fields, calling get_entity_detail without submit_finding, invalid format). High nudge counts mean the agent is bouncing off guardrails. A negative nudges-vs-composite correlation is the warning signal: nudges firing without improving outcomes.
SQL
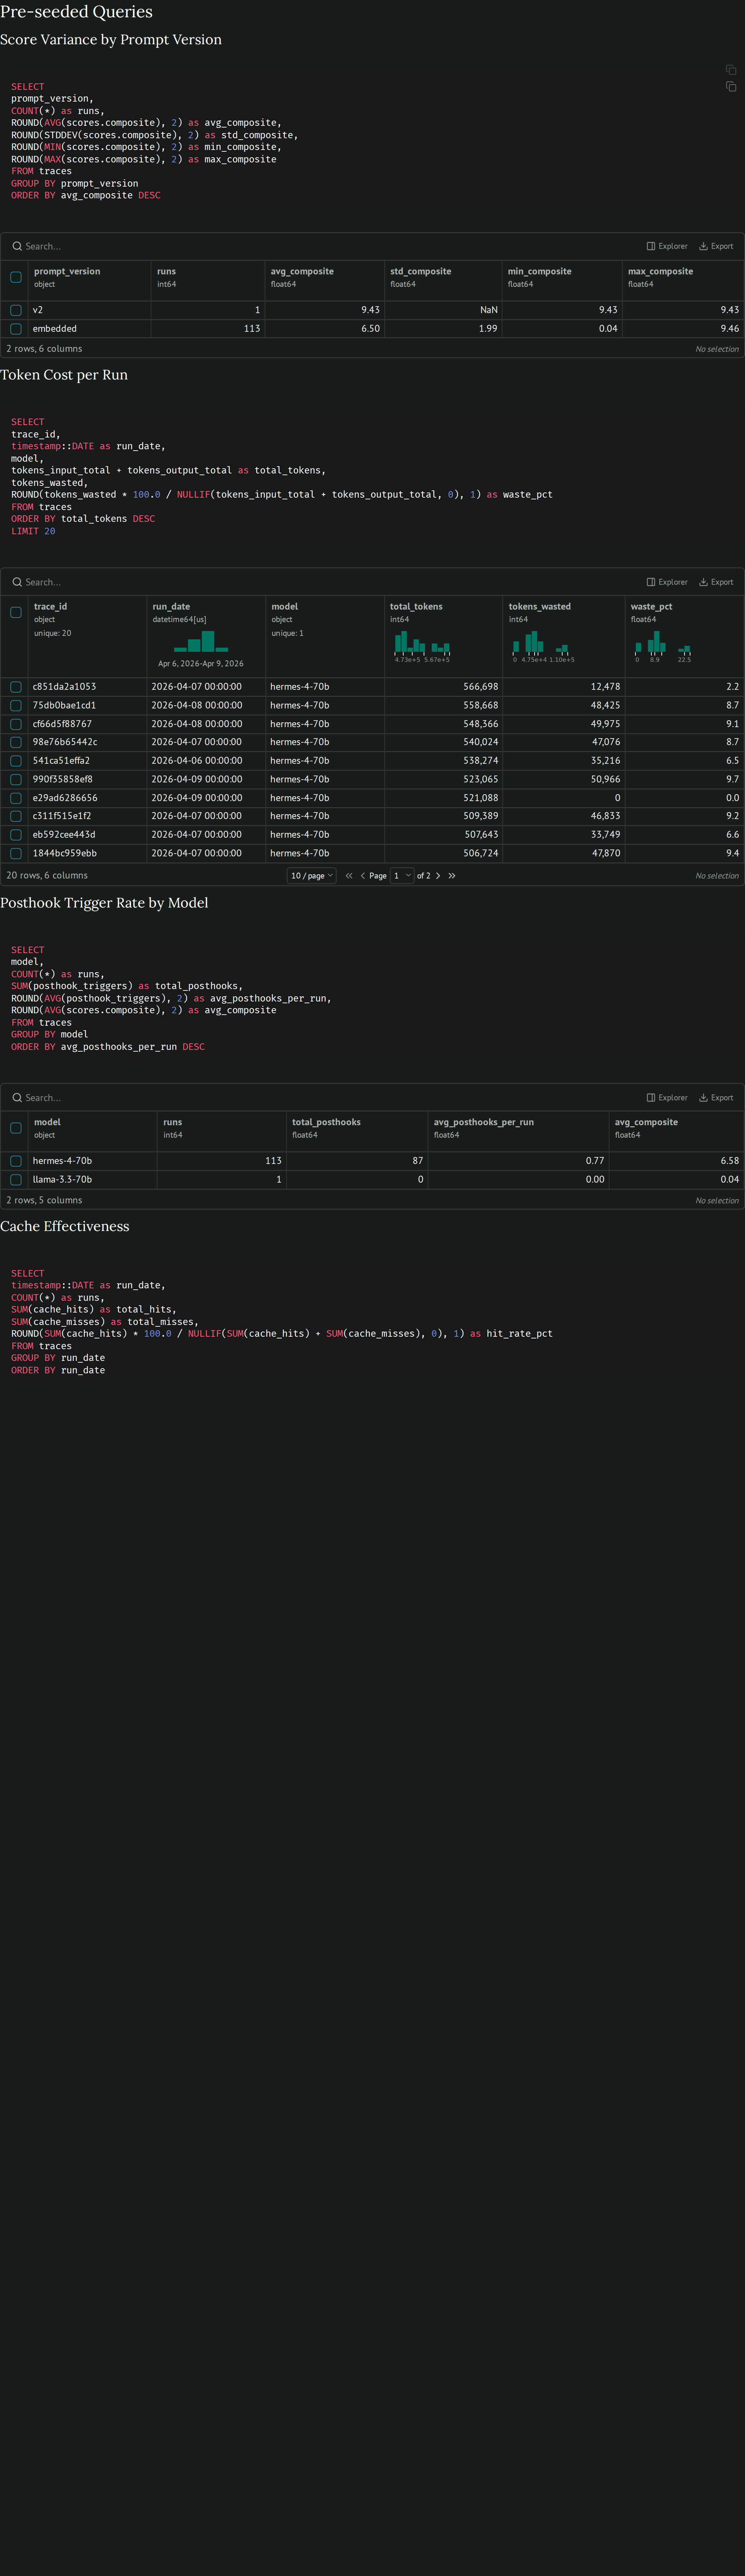
Five pre-seeded DuckDB queries (score variance by prompt version, token cost per run, post-hook trigger rate by model, cache effectiveness, eviction correlation with scores) plus three custom query editors for ad-hoc investigation. The pre-seeded queries are the ones I kept re-typing, promoted into the UI.
Current observations (updated 2026-04-11)
2026-04-11: evidence_breadth plateau broken
The 0.84 evidence_breadth ceiling that showed up across 107 hermes runs was a vocabulary gap, not a tool-count or prompt problem. The scorer uses canonical source names (suricata, stream_dns, stream_http, fortigate, auth_log, wineventlog) for exact string matching, but the agent was writing informal names (dns, http, auth, windows). One prompt fix (an explicit 6-row mapping table) pushed evidence_breadth from 0.84 median to 0.97 median across 22 new runs. Composite went from 9.30 to 9.74. Two runs hit a perfect 10.0/10.
Secondary finding: evidence_breadth anti-correlates with entity count at the per-finding level. Runs investigating 8 entities averaged 0.976 breadth; runs investigating 15 averaged 0.952. This comes from the score_evidence formula averaging source_coverage / total_findings, so more diverse entities pull the average down. Not a bug, but worth knowing when comparing runs with different entity counts.
The agent still writes informal source names about 9% of the time. The runs that score 0.919 evidence_breadth are the ones with the most informal-name findings.
See the debugging observations for the full story of how this was found.
2026-04-10 (initial observations)
First pass against the 114 backfilled records spanning 5 experiment directories.
- Hermes-4-70B is the clear baseline at 9.3 composite. Cross-model runs on the same prompt show Nemotron-3-Super-120B jumping from 3.45 to 7.01 after the post-hook fix, which is a real lift but still well below Hermes. Agent-specific training appears to matter more than raw parameter count on this task.
- Token waste is low in passing runs. Healthy runs show input:output token ratios where output is a small fraction of input, suggesting the model is concise when the loop is working. Verbose failure modes (Nemotron-3-Super at 1449 tokens per submit_finding vs Hermes at 350) fill context quickly and cause overflow inside four turns.
- GPT-OSS-20B and Llama-3.3-70B are broken for agent use at the moment. GPT-OSS-20B writes 2000-token essays instead of tool calls. Llama-3.3-70B produces zero LLM responses (llama.cpp chat template issue). Both show up as flat zero composite scores across all dimensions.
Open questions
- Does the evidence breadth ceiling come from the 5 W's framework being too soft, or from the scorer counting raw source coverage instead of specific W-coverage (Who / What / When / Where / Why)?
- Is the
cache_hitsmetric gameable in a way that hurts investigation quality? An agent that keeps asking for the same entity's data with no progress looks cache-efficient but is actually stuck. - Is there a threshold of post-hook triggers above which composite score starts dropping? The nudges-vs-score scatter should reveal this once more data lands.
- Does the eviction-correlation query surface a clean relationship between number of context evictions and coverage drops, or is the effect dominated by other variables?
What we've learned so far
- 2026-04-10: A trace explorer built around "good vs investigate" descriptors is faster to act on than raw SQL, because each chart already encodes what the experiment designer should look for. The SQL tab exists for everything the pre-seeded charts do not answer.
- 2026-04-10: Daily-rotated JSONL with DuckDB
read_json_autois enough for 100 to 1000 traces. No database, no migrations, no schema work. A single file per day keeps diffs readable and scp backups cheap. - 2026-04-11: The 0.85 evidence_breadth plateau was a vocabulary gap, not a prompt or tool-count problem. Score jumped from 0.84 to 0.97 with one mapping table in the prompt. Three prior experiments targeting this metric failed because Claude proposed fixes without reading the scorer code first. Once I made it read
scorer_v2.pyline by line, the string-matching issue was obvious.